
Data Analysis and Applied Statistics for Business
Master essential Data skills applicable in real workplace scenarios
Join 3-day offline training with proven materials + BNSP certification
Sessions are guided by seasoned practitioners
Investment of Rp7.000.000 per participant
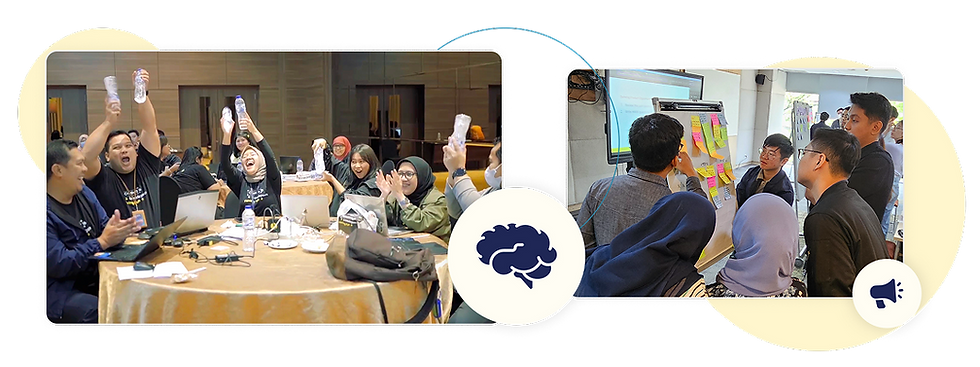
Connect with professionals from diverse industries
Materi Pelatihan
Apa yang Akan Kamu Pelajari?
Dapatkan pemahaman menyeluruh tentang topik sertifikasi melalui pembelajaran interaktif dan studi kasus relevan.
Data Analysis and Applied Statistics for Business
Data Analytics Foundations & Data Cleaning
Data Cleaning with Spreadsheets
Descriptive Statistics & Outliers
EDA & Correlation Analysis
Dashboarding & Data Visualization
Data Communication: Storytelling with Data
BNSP Assessment Day
Data Analytics Foundations & Data Cleaning
Introduction to Statistics & Analytics Workflow
Understand statistics, data, and their application in business decision-making.
Learn about the analytics workflow, focusing on data quality and key functions in Google Sheets (SUM, AVERAGE, COUNTIF, etc.).
Explore basic statistical processes used in daily analytics tasks.
Data Cleaning with Spreadsheets
Master data cleaning techniques: handling missing, irrelevant, and duplicate data with functions like REMOVE DUPLICATES, TEXT TO COLUMNS, and FILTER().
Format and merge datasets efficiently using Google Sheets functions (VLOOKUP, CONCATENATE).
Create and interpret Pivot Tables, simple charts (bar, line, pie), and apply important data cleaning formulas.
Descriptive Statistics & Outliers
Understand central tendency (mean, median, mode) and dispersion (standard deviation, variance).
Learn to identify and handle skewness and outliers using box plots and scatter plots.
Apply Exploratory Data Analysis (EDA) techniques to explore data and uncover patterns.
EDA & Correlation Analysis
Apply EDA techniques to explore datasets with scatter plots, histograms, and box plots.
Learn about covariance and correlation to analyze relationships between variables.
Study real-life examples of correlation in business
Dashboarding & Data Visualization
Learn how to create interactive dashboards using Google Sheets for tracking KPIs.
Use visualizations like heat maps, bar charts, line charts, and area charts to communicate insights effectively.
Build simple yet impactful data visualizations to highlight trends and support decision-making.
Data Communication: Storytelling with Data
Data Communication structure
Begin writing the presentation: structure & storyboarding
Final project Exercise
BNSP Assessment Day
Jadwal Kelas Terdekat

Persyaratan
Persyaratan untuk Mengikuti Sertifikasi
Cek persyaratan lengkap sebelum mengikuti sertifikasi. Dapat dipenuhi salah satunya.
Understand key statistical concepts and their role in business decision-making
Clean and explore data to uncover patterns, trends, and insights
Apply correlation, regression, and hypothesis testing for deeper analysis
Interpret statistical results to guide strategic actions
Use data-driven insights to support business growth and innovation
Materi Pelatihan
Apa yang Akan Kamu Pelajari?
Dapatkan pemahaman menyeluruh tentang topik sertifikasi melalui pembelajaran interaktif dan studi kasus relevan.
Data Analysis and Applied Statistics for Business
Data Analytics Foundations & Data Cleaning
Introduction to Statistics & Analytics Workflow
Understand statistics, data, and their application in business decision-making.
Learn about the analytics workflow, focusing on data quality and key functions in Google Sheets (SUM, AVERAGE, COUNTIF, etc.).
Explore basic statistical processes used in daily analytics tasks.
Data Cleaning with Spreadsheets
Master data cleaning techniques: handling missing, irrelevant, and duplicate data with functions like REMOVE DUPLICATES, TEXT TO COLUMNS, and FILTER().
Format and merge datasets efficiently using Google Sheets functions (VLOOKUP, CONCATENATE).
Create and interpret Pivot Tables, simple charts (bar, line, pie), and apply important data cleaning formulas.
Descriptive Statistics & Outliers
Understand central tendency (mean, median, mode) and dispersion (standard deviation, variance).
Learn to identify and handle skewness and outliers using box plots and scatter plots.
Apply Exploratory Data Analysis (EDA) techniques to explore data and uncover patterns.
EDA & Correlation Analysis
Apply EDA techniques to explore datasets with scatter plots, histograms, and box plots.
Learn about covariance and correlation to analyze relationships between variables.
Study real-life examples of correlation in business
Dashboarding & Data Visualization
Learn how to create interactive dashboards using Google Sheets for tracking KPIs.
Use visualizations like heat maps, bar charts, line charts, and area charts to communicate insights effectively.
Build simple yet impactful data visualizations to highlight trends and support decision-making.
Data Communication: Storytelling with Data
Data Communication structure
Begin writing the presentation: structure & storyboarding
Final project Exercise
BNSP Assessment Day
Data Analytics Foundations & Data Cleaning
Data Cleaning with Spreadsheets
Descriptive Statistics & Outliers
EDA & Correlation Analysis
Dashboarding & Data Visualization
Data Communication: Storytelling with Data
BNSP Assessment Day
Persyaratan
Persyaratan untuk Mengikuti Sertifikasi
Cek persyaratan lengkap sebelum mengikuti sertifikasi. Dapat dipenuhi salah satunya.
Understand key statistical concepts and their role in business decision-making
Clean and explore data to uncover patterns, trends, and insights
Apply correlation, regression, and hypothesis testing for deeper analysis
Interpret statistical results to guide strategic actions
Use data-driven insights to support business growth and innovation
Similar Programs
Program Rekomendasi Lainnya


Metode Pembelajaran Revou
Lebih Modern, Lebih Interaktif, Lebih Efektif
Standar baru dalam pelatihan sertifikasi, RevoU mempersiapkanmu secara menyeluruh untuk tantangan industri.

Top Trainers & Mentors
Receive full support from experienced trainers and mentors throughout the training, portfolio building, and assessment process.

Comfortable Facilities & Locations
Training is held in comfortable, accessible venues, complete with full logistics, meals, and high-quality amenities.
Interactive Learning
Go beyond learning from slides. Peer reviews, group discussions, and quizzes make the learning experience more engaging and effective.

Meaningful Networking
Connect with professionals from diverse industries to exchange ideas and grow your network—during and after the training.
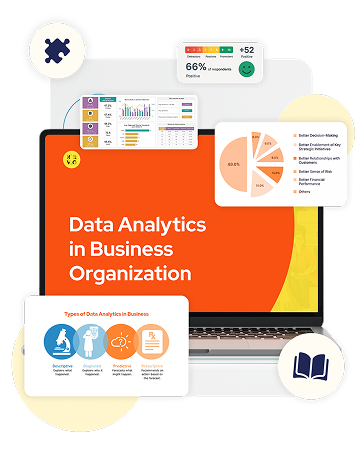
Modern Learning Materials
Learning materials such as videos, infographics, and interactive presentations help participants understand concepts more easily.


mengapa revou
Mengapa Memilih RevoU Sebagai Partner Sertifikasi?

Small Group, Maximum Impact
With a compact class size, we ensure every participant gets personalized feedback, focused attention, and a collaborative learning experience.

Ready-to-Go Training
No need to spend weeks on planning. Just choose a date, enroll, and begin upskilling your team with proven materials.

Multi Industry Networking
Expose your team to real-world case studies, fresh insights, and problem-solving strategies beyond your own company walls.

Led by Industry Experts
Sessions are guided by seasoned practitioners who bring real-world experience and most up-to-date insights to every class.
FAQ
Frequently Asked Questions
Sertifikasi BNSP adalah pengakuan resmi dari Badan Nasional Sertifikasi Profesi yang menandakan bahwa seseorang memiliki kompetensi sesuai standar nasional. Bagi perusahaan, ini penting untuk memenuhi regulasi, meningkatkan kredibilitas SDM, dan menunjang tender atau audit ISO.
Jika peserta belum berhasil lulus dalam ujian sertifikasi, RevoU memberikan kesempatan untuk mengikuti satu kali ujian ulang secara gratis sesuai ketentuan yang berlaku.
Pendaftaran dimulai dengan memilih keahlian dan persyaratan yang sesuai, kemudian RevoU akan mendampingi proses dari awal hingga peserta mendapatkan sertifikasi resmi.